veeral does data
Building a Web Application to Predict NFL 4th Down Play Selection
14 April, 2021This is a blog post outlining my process building this ML app. The actual app and its repo can be found here:
Introduction
About a year and a half ago, I used Random Forest classification to predict an NFL's team play. That project was a fun experience to start to learn to apply machine learning to real-world data with a goal in mind, but the project ultimately ended with a trained model in a Jupyter Notebook and corresponding blog post outlining my process. Since then I've learned an important lesson that machine learning models are not useful unless they make it to production. If you can't use the power of a complex prediction model, what's the point?
This is where Streamlit comes in. Streamlit is a software platform made for data scientists that turns python scripts into shareable web apps. All in Python and all for free!
The post will outline my entire pipeline of building this app, from acquiring and cleaning the data, to fitting my best model, to ultimately using my analysis and predictive model within my web application. The best part about writing this post is the ability to point to my live, ML app. Check it out to see the final output!
Machine Learning Pipeline
1) Acquire Data
I used this github repo of NFL play-by-play data scraped using the nflfastR package.
2) Set up Preprocessing/Modeling Pipeline
a) Write Functions to Preprocess Data for Modeling
First, I wrote a few processing functions to clean my data. For example, I created a "convert yard line" function to convert given yard line values like NYG 30, to numerical values depicting yards from own endzone, so the NY Giants at the NYG 30 would be 30 yards out from their own endzone.
Additionally, I cleaned up differences in team names, and filtered the data for only 4th down plays where the resulting action was a pass play, run play, field goal attempt, or punt.
b) Use sci-kit learn pipeline to structure all preprocessing and modeling in one place
I then used Pipeline functionality to group all my preprocessing with my modeling. This step is particularly important because it preserves data consistency throughout the modeling process. This included a feature engineering step of creating a variable grouping score differential to pick up the non-linear play selection decision process at different score-differential groups (one-score game vs two-score game)
My pipeline has 3 steps:
1) Column Selection & Transformation: Apply data cleaning and filtering, and column selection using function filter_data within a Function Transformer
2) Preprocessing: Impute continuous variables, and impute & one-hot-encode categorical variables
3) Fit: Gradient Boosting Classifier
Here's a code snippet of what my Pipeline looks like
categorical_columns = filter_data(X_train).dtypes != float
con_pipe = Pipeline([
                     ('imputer', SimpleImputer(strategy='median', add_indicator=True))
                    ])
cat_pipe = Pipeline([('imputer', SimpleImputer(strategy='most_frequent', add_indicator=True)),
                     ('ohe', OneHotEncoder(handle_unknown='ignore'))
                    ])
preprocessing = ColumnTransformer([('categorical', cat_pipe,  categorical_columns),
                                   ('continuous',  con_pipe, ~categorical_columns),
                                   ])
pipe_gb = Pipeline([
    ('transform',FunctionTransformer(filter_data,validate=False)),
    ('preprocessing', preprocessing),
    ('gb',GradientBoostingClassifier(
                            ))
])
3) Use Cross Validation hyperparameter tuning to fit best model
I then use a RandomizedSearchCV to tune my hyperparameters to find and fit my best model
gb_hyperparams = dict(gb__learning_rate = [0.15,0.1,0.05,0.01], # How quickly should GB Classifier adjust weights to get to optimal value
                      gb__n_estimators  = [50,100,150], # Number of trees
                      )

gb_rand_cv = RandomizedSearchCV(estimator=pipe_gb,
                                param_distributions=gb_hyperparams,
                                n_iter=25,
                                cv=5,
                                n_jobs=-1,
                                verbose=True,
                                scoring='accuracy')
gb_rand_cv.fit(X_train, y_train)
I then saved the best estimator (using pickle) and put it away for later
5) Build my Streamlit python app script
First, I create a new python script. Then, using streamlit's widget functionality like select-box, slider, number-input, time-input, I allow users to set their own game situation by defining their unique 4th down game situation and all the my model's features that go into prediction. This includes picking teams, time, down, yards to go, and more.
I then use my pipeline to preprocess this new data as if it was a test dataset in my Jupyter Notebook, and spit out a prediction using my pre-trained, saved Gradient Boosting classfier!
7) Use Plotly to provide interactive visualizations prediction context

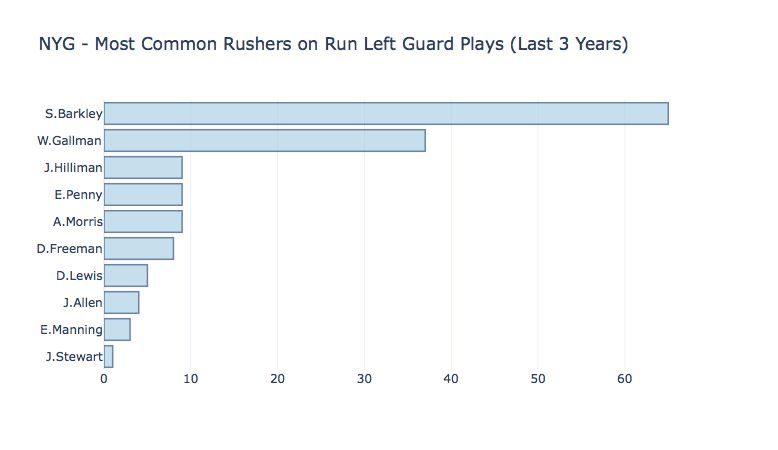
After outputting whether a particular user-selected situation predicts a run to the left end, a deep pass to the right, a field goal attempt, or any other play option, I've proceed to provide a little context the situation using Plotly interactive visualizations. Lets say the situation predicts the Giants running towards the right tackle, the next step to understand the context of that prediction is to better understand the personnel involved in a play like that. Therefore, right under the play prediction I provide that context with the top 10 players in the last 3 years that have been called upon in that type of play.