veeral does data
NFL Play Predictive Analysis
20 February, 2020
Introduction
I have been learning a lot recently about different machine learning classification algorithims. Classification is an extremely useful supervised learning tool in data science and machine learning for analyzing examples and fitting them into preselected bins/categories. There are a variety of classification algorithims out there today, including logistic regression, decision trees, support vectors machines, Naive Bayes, and more.
In this post, I will be diving into Random Forest Classification. I am going to use a random forest classifier to build a predictive analysis model on NFL Play-By-Play data from 2009-2018. My model will input a play situation, including variables such as time, down, yards to go, score, etc., and output a play type prediction.
Motivation
The power to predict play types in the NFL would be an incredible advantage, both from the offensive and defensive perspectives.
Offenses: Use predictive analyses to make critical decisions such as deciding between going for it on 4th down, or choosing to kick a field goal.
Defenses: Use predictive analyses to understand opposing offenses and build defensive schemes specific to disrupt set offensive plays.
Data
I will be using Max Horowitz's NFL 2009-2018 Play-By-Play dataset from Kaggle and analyzing the data on Python. I will be utilizing various Python data science and machine learning packages to supplement my analyses.
import pandas as pd
import numpy as np
import matplotlib.pyplot as plt
import seaborn as sns
import sklearn
import fastai
%matplotlib inline
Cleaning/Feature Engineering
A computer cannot understand words like 'punt' or 'pass'. Therefore, I need to transform my data into an all-numeric data set to effectively utilize sklearn's Random Forest Classifier algorithim. In order to transform my current data, I'm going to need to define, adjust, and clean my data.
Variables
Y - Dependent variable:
-
play_type: Categorical variable with 4 classes:
- punt
- field goal
- run
- pass
X - Independent variable:
- pos team: Team on offense
- def team: Team on defense
-
yard line 100: The yardline the ball lies on
- OWN 32 = 32
- OPP 14 = 86
- half seconds remaining
- game seconds remaining
- Half 2: binary variable, 1 if play in 2nd Half, 0 otherwise
- OT: binary variable, 1 if play in Overtime, 0 otherwise
- drive: what number drive is it for posteam
- down
- yds to go: Yards to go for 1st down/end zone
- score_differential: Current score differential at time of play. Negative indicates losing, positive indicates winning, 0 indicates score is tied
- goal to go: binary variable, 1 if goal to go situation, 0 otherwise
- no huddle: binary variable, 1 if posteam in no_huddle, 0 otherwise
- wp: Win Probability
- Year
- Month
Encoding Categorical Data and Dealing with Missing Values
After identifying my variables and features, I need to encode my categorical variables. My dependent variable, 'play type', has been filtered only to punt, field goal, run, and pass plays to eliminate extraneous plays such as kickoffs, penalties, and extra points. I encode my 4 play_types as 0, 1, 2, and 3. Additionally, I encode the team names in pos team and def team from 0-31 to represent each of the 32 teams in the NFL.
Next, I fill all missing values in game/half seconds remaining. These empty cells seem to be some kind of collection error, but can be filled in fairly easily using the a combination of the "quarter", and "quarter seconds remaining" variables. This is a necessary step of cleaning my data to avoid errors on null data.
Preprocessing
I split my data up into training set, validation set, and test set. I will train my algorthim on the training set, validate it works and adjust the parameters of my algorithim on the validation set, and the ultimately see its utility on the test set.
- Training set: 2009-2016
- Validation set: 2017
- Test set: 2018
Baseline
To evaluate the performance of my algorithim, I need a baseline accuracy to compare with. This is essential to my analysis, because accuracy is a relative meaure. Achieving 90% accuracy seems successful, but is useless if a random guessing baseline yields 95% accuracy.
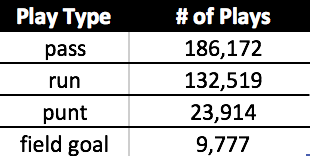
As seen above, more than 180,000 of my almost 350,000 plays are pass plays. Therefore, I will be using the baseline of predicting every play as a pass play. This incredibly simple prediction model achieves a 52% accuracy score. Lets see how much I can improve on that.
What is a Random Forest Classifier?
A great question. In fact, its the most important question to this whole analysis. A random forest classifier is a complex machine learning classification algorithim composed of several much simpler, intuitive decision trees.
I think of a 'decision tree' as a analytical version of the classic game, 21 questions, with the '21' representing the depth of the tree. How many True/False questions would you have to ask before confidently predicting the answer?
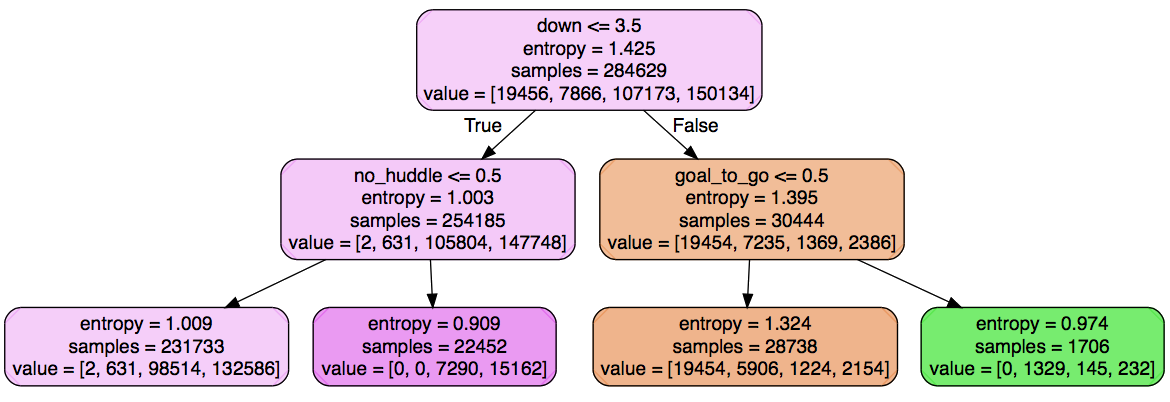
The above is my simple NFL play prediction decision tree. We start at the top node. The tree is split based on the variable 'down' at the value 3.5, essentially performing the 21-question version of asking "Is it 4th down?"
A subsample of plays in which down<=3.5 (1st, 2nd, and 3rd down plays) is True move down to the left. The subsample of 4th down plays move to the right node. This is already an incredible insight, as punts and field goals are almost exclusively done on 4th downs, so this split would immediately help classification between punt/field goals and run/pass plays.
The decision tree chooses variables and splits based on optimizing information entropy, or more colloquially, information gain. From all possible variable splits, which variable split provides the most information towards making a concrete prediction? The variable,'Down', split at 3.5, provides the most information, and is consequently placed at the top node. The next level then finds the next variable split that optimizes entropy in its new subample, and the process continues.
How does this simple decision tree build a much more powerful random forest?
A random forest classifier consists of several of these simple decision trees with each tree going into much further depths than the 2-level simple tree in the above diagram.
The key to the random forest model is a concept coined Bagging, or more formally, Bootstrap Aggregation. Bagging creates a system where each tree of a random forest is created on a randomly chosen subset of the training data (with replacement). With decision trees so heavily dependent on the dataset, each tree will be distinctive, and together the trees will encompass the entire data set.
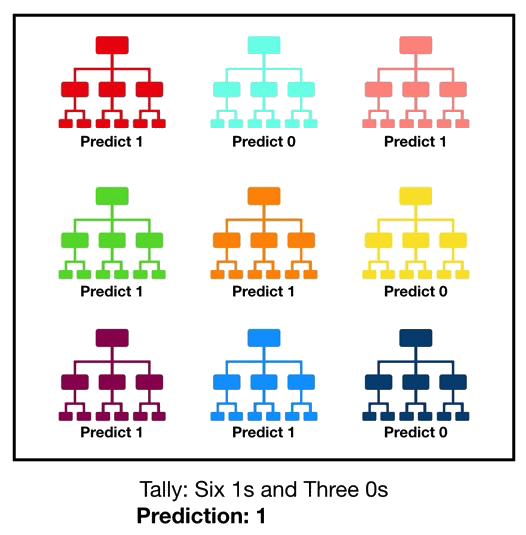
As shown above, each tree outputs a prediction, and the class with the most predictions is considered the final prediction. In a 10-tree forest, if 3 trees predict run, 1 tree predicts pass, and 6 trees predict field goal, The final prediction will be field goal for that particular play given the play's situation features.
Parameters
I will be using the RandomForestClassifier function from the sklearn.ensemble package. The package offers a variety of useful parameters that allow me to tailor my classification.
Below is my unofficial descriptions of some of the key parameters:
- n_estimators: Number of trees
- max_depth: how many levels each tree to reach at maximum (earlier example = 2)
- criterion: variable to measure information gain from each variable split
- min samples split: Minimum samples at which to no longer split data subset
Algorithim
I'm (finally) all ready to run the algorithim.
I split my training data into the aforementioned X and Y data. Then, I create a RandomForestClassifier object and train my data:
m = RandomForestClassifier(n_estimators=50,criterion='entropy',n_jobs=-1,max_depth=16)
clf = m.fit(X_train, y_train)
Then, I build a NumPy array of predictions using the m.predict(X_valid) method on my X validation set.
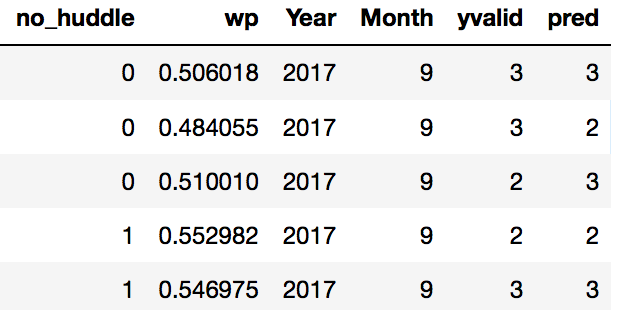
Lastly, I compare the predictions to the true y_validation set and output an accuracy score to evaluate my algorithim. Here's a view of my full validation set with each row representing a play with a True yvalid value and corresponding prediction y value:

Results
The algorithim worked well! Compared to the 52% baseline, the model delivered 72.35% accuracy, improving on the baseline by almost 20 basis points!
To further analyze my results and look for areas of improvement, I built a confusion matrix to show where the model did well and where it struggled:

The diagonal of the matrix shows all accurate predictions! Not too bad for my first attempt at a random forest.
Here are my accuracies separated by play:
punt: 98.8%
field goal: 93.4%
pass: 72.9%
rush: 65.1%
My algorithim did very well classifying punts and field goals. However, it clearly has the most trouble interchanging running and passing plays.
Areas for Further Improvement
My algorithim worked well, but there were a few areas of potential adjustment and further research that could yield improved results.
Look for correlations between incorrect data
With 27.65% of my data incorrect, a first, next step in the pursuit of model accuracy improvement would be to analyze my incorrect data. What stands out? What is not being understood well my the random forest?
Find new features
The algorithim only correctly identified 65% of rushing plays, by far the lowest percentage. There must be room for improvement.
One such idea that could lead to improvement would be to add additional features to better classify incorporate game weather. Perhaps, teams tend to run more when it is windy out, or run more when its raining and the ball is too slick to throw.
Address collinearity
Collinearity occurs when some of the independent features in a model are highly correlated. This can potentially be limiting my model, as highly correlated variables may get in the way of each other in the process of identifying
The variables, 'wp','score_differential', and 'game seconds remaining' may be collinear as wp is heavily dependent on a combination of score differential and game time left.
Better fine-tune parameters
As this is my first Random Forest Classifier, I am still developing a more comprehensive understanding of how to fine-tune particular features to improve my data.
Try other machine learning classification models
More on this hopefully coming soon!!